LinkedIn Activity Tracker turns your LinkedIn routine into a daily game — goals, streaks, and a year-long heatmap — and shows how your Social Selling Index responds to the work you put in. No automation. Nothing leaves your browser.

SSI rewards people who show up every day. The tracker makes showing up visible — and a little addictive.
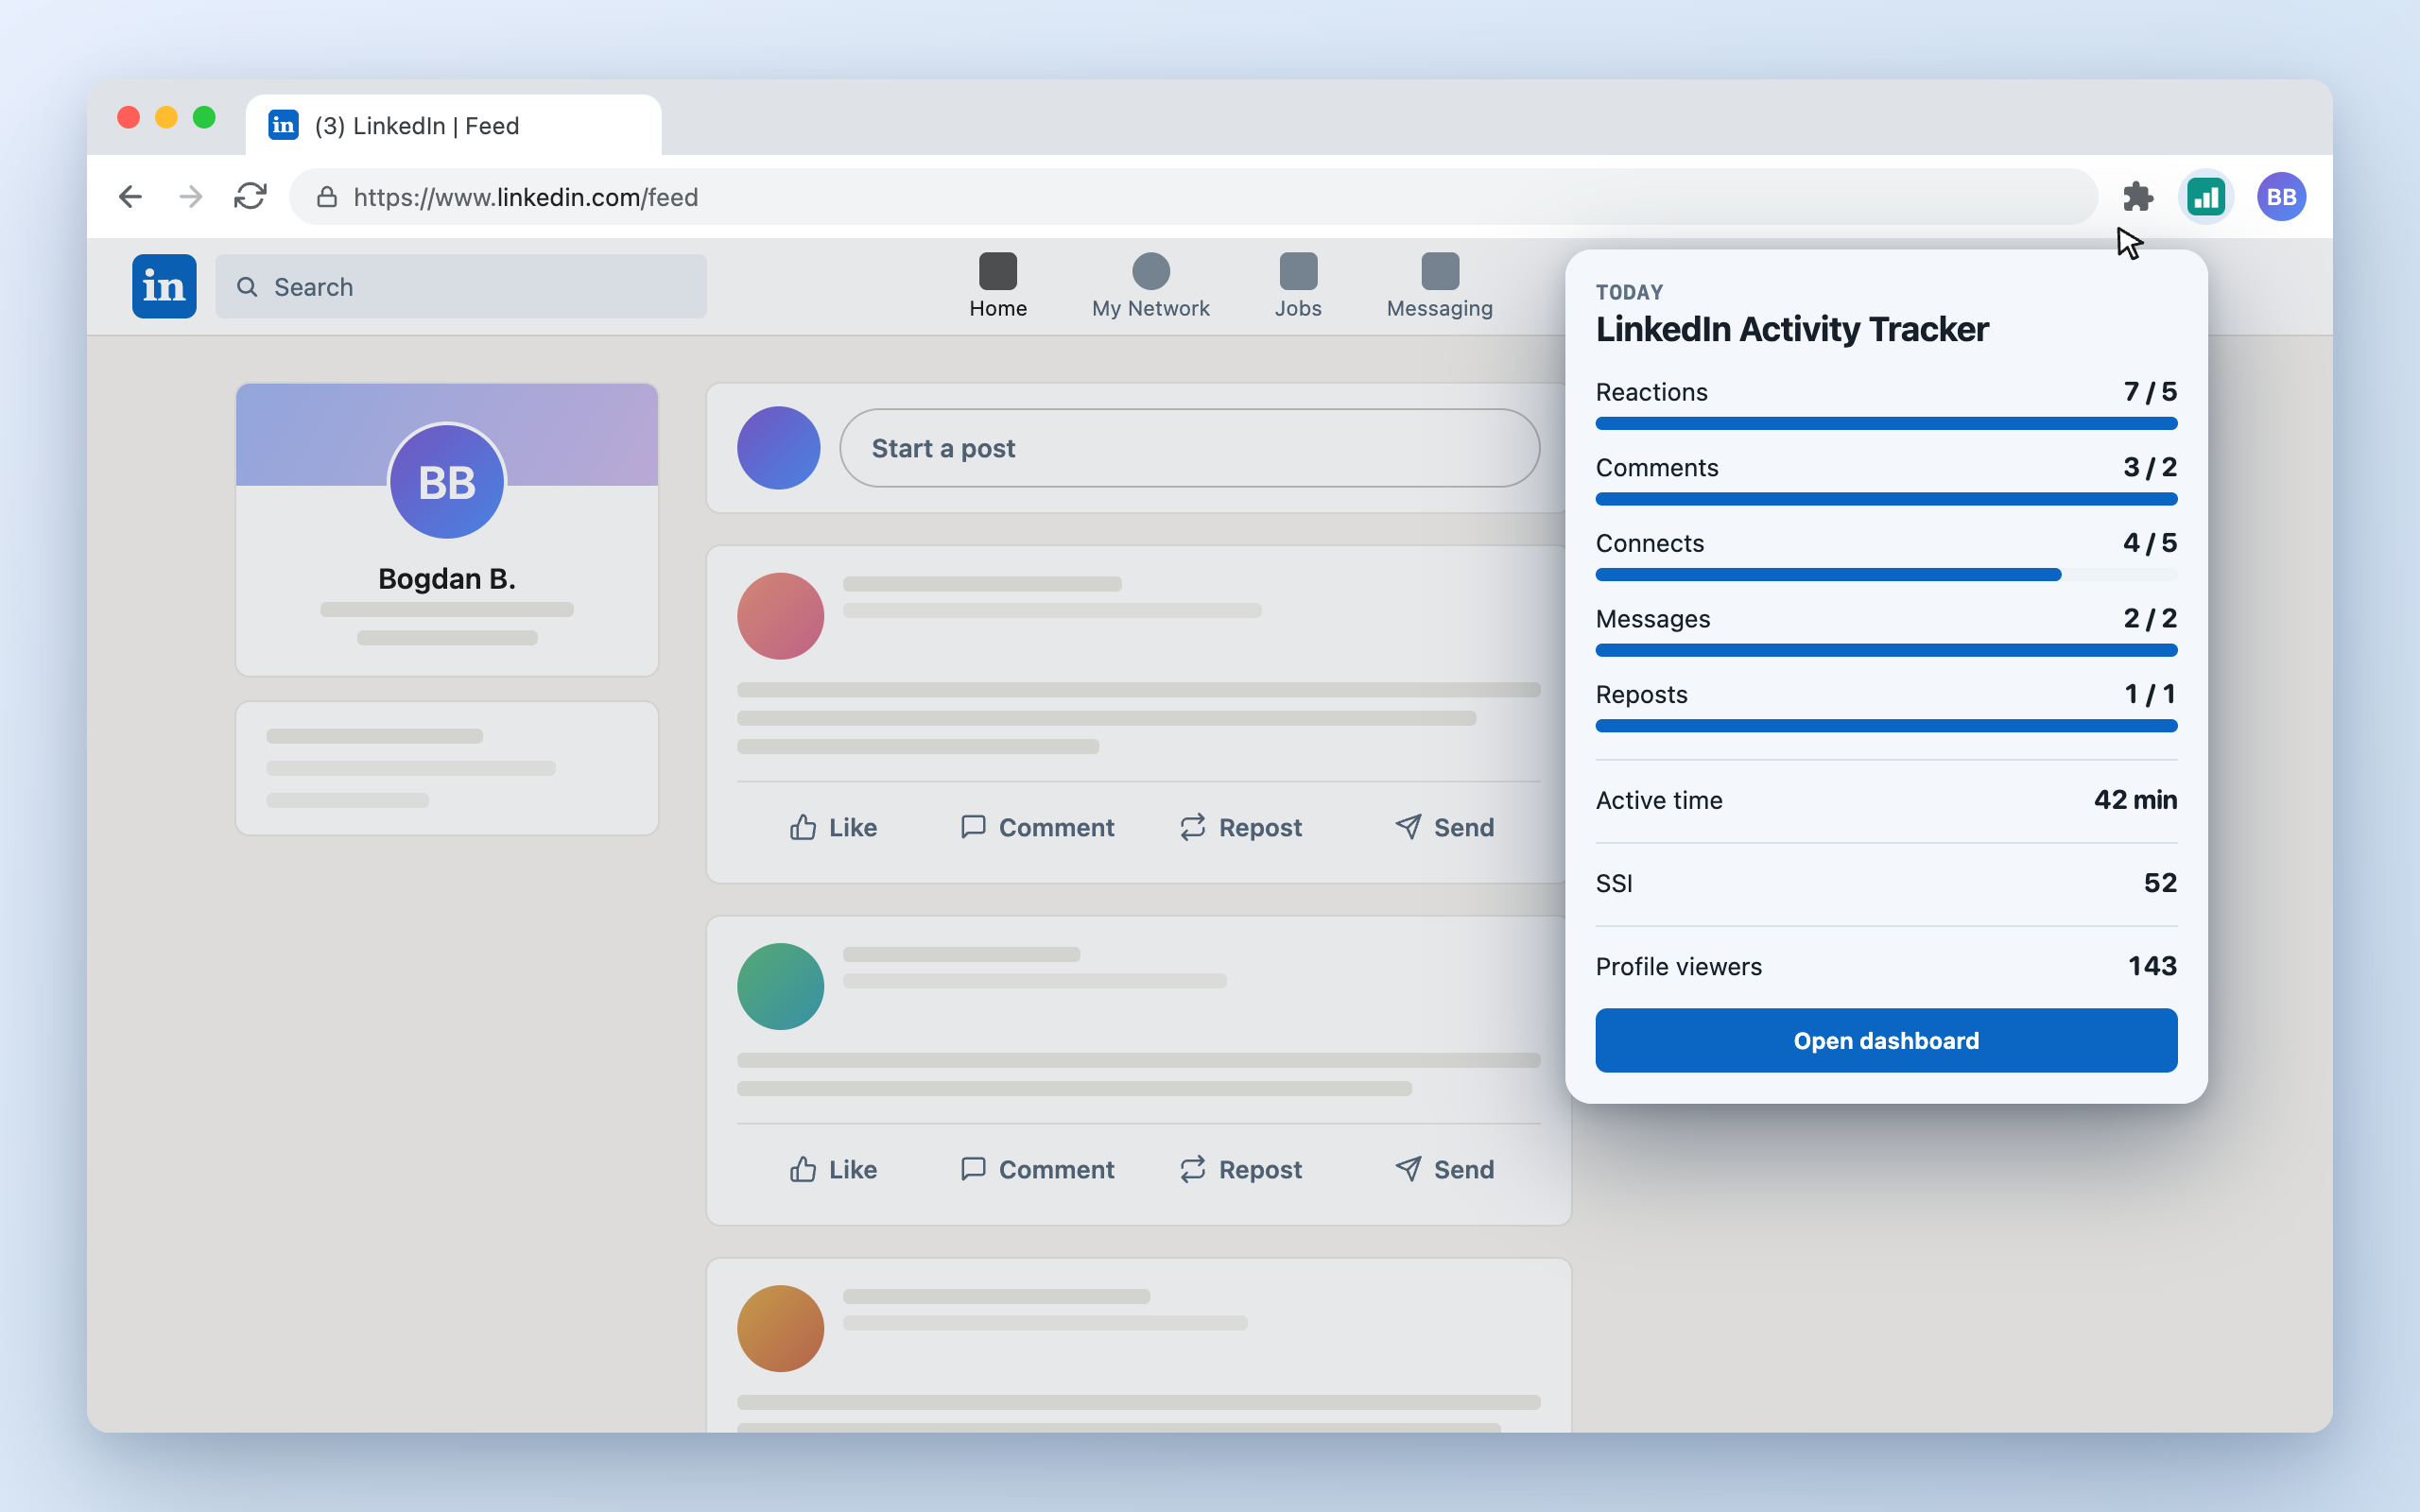
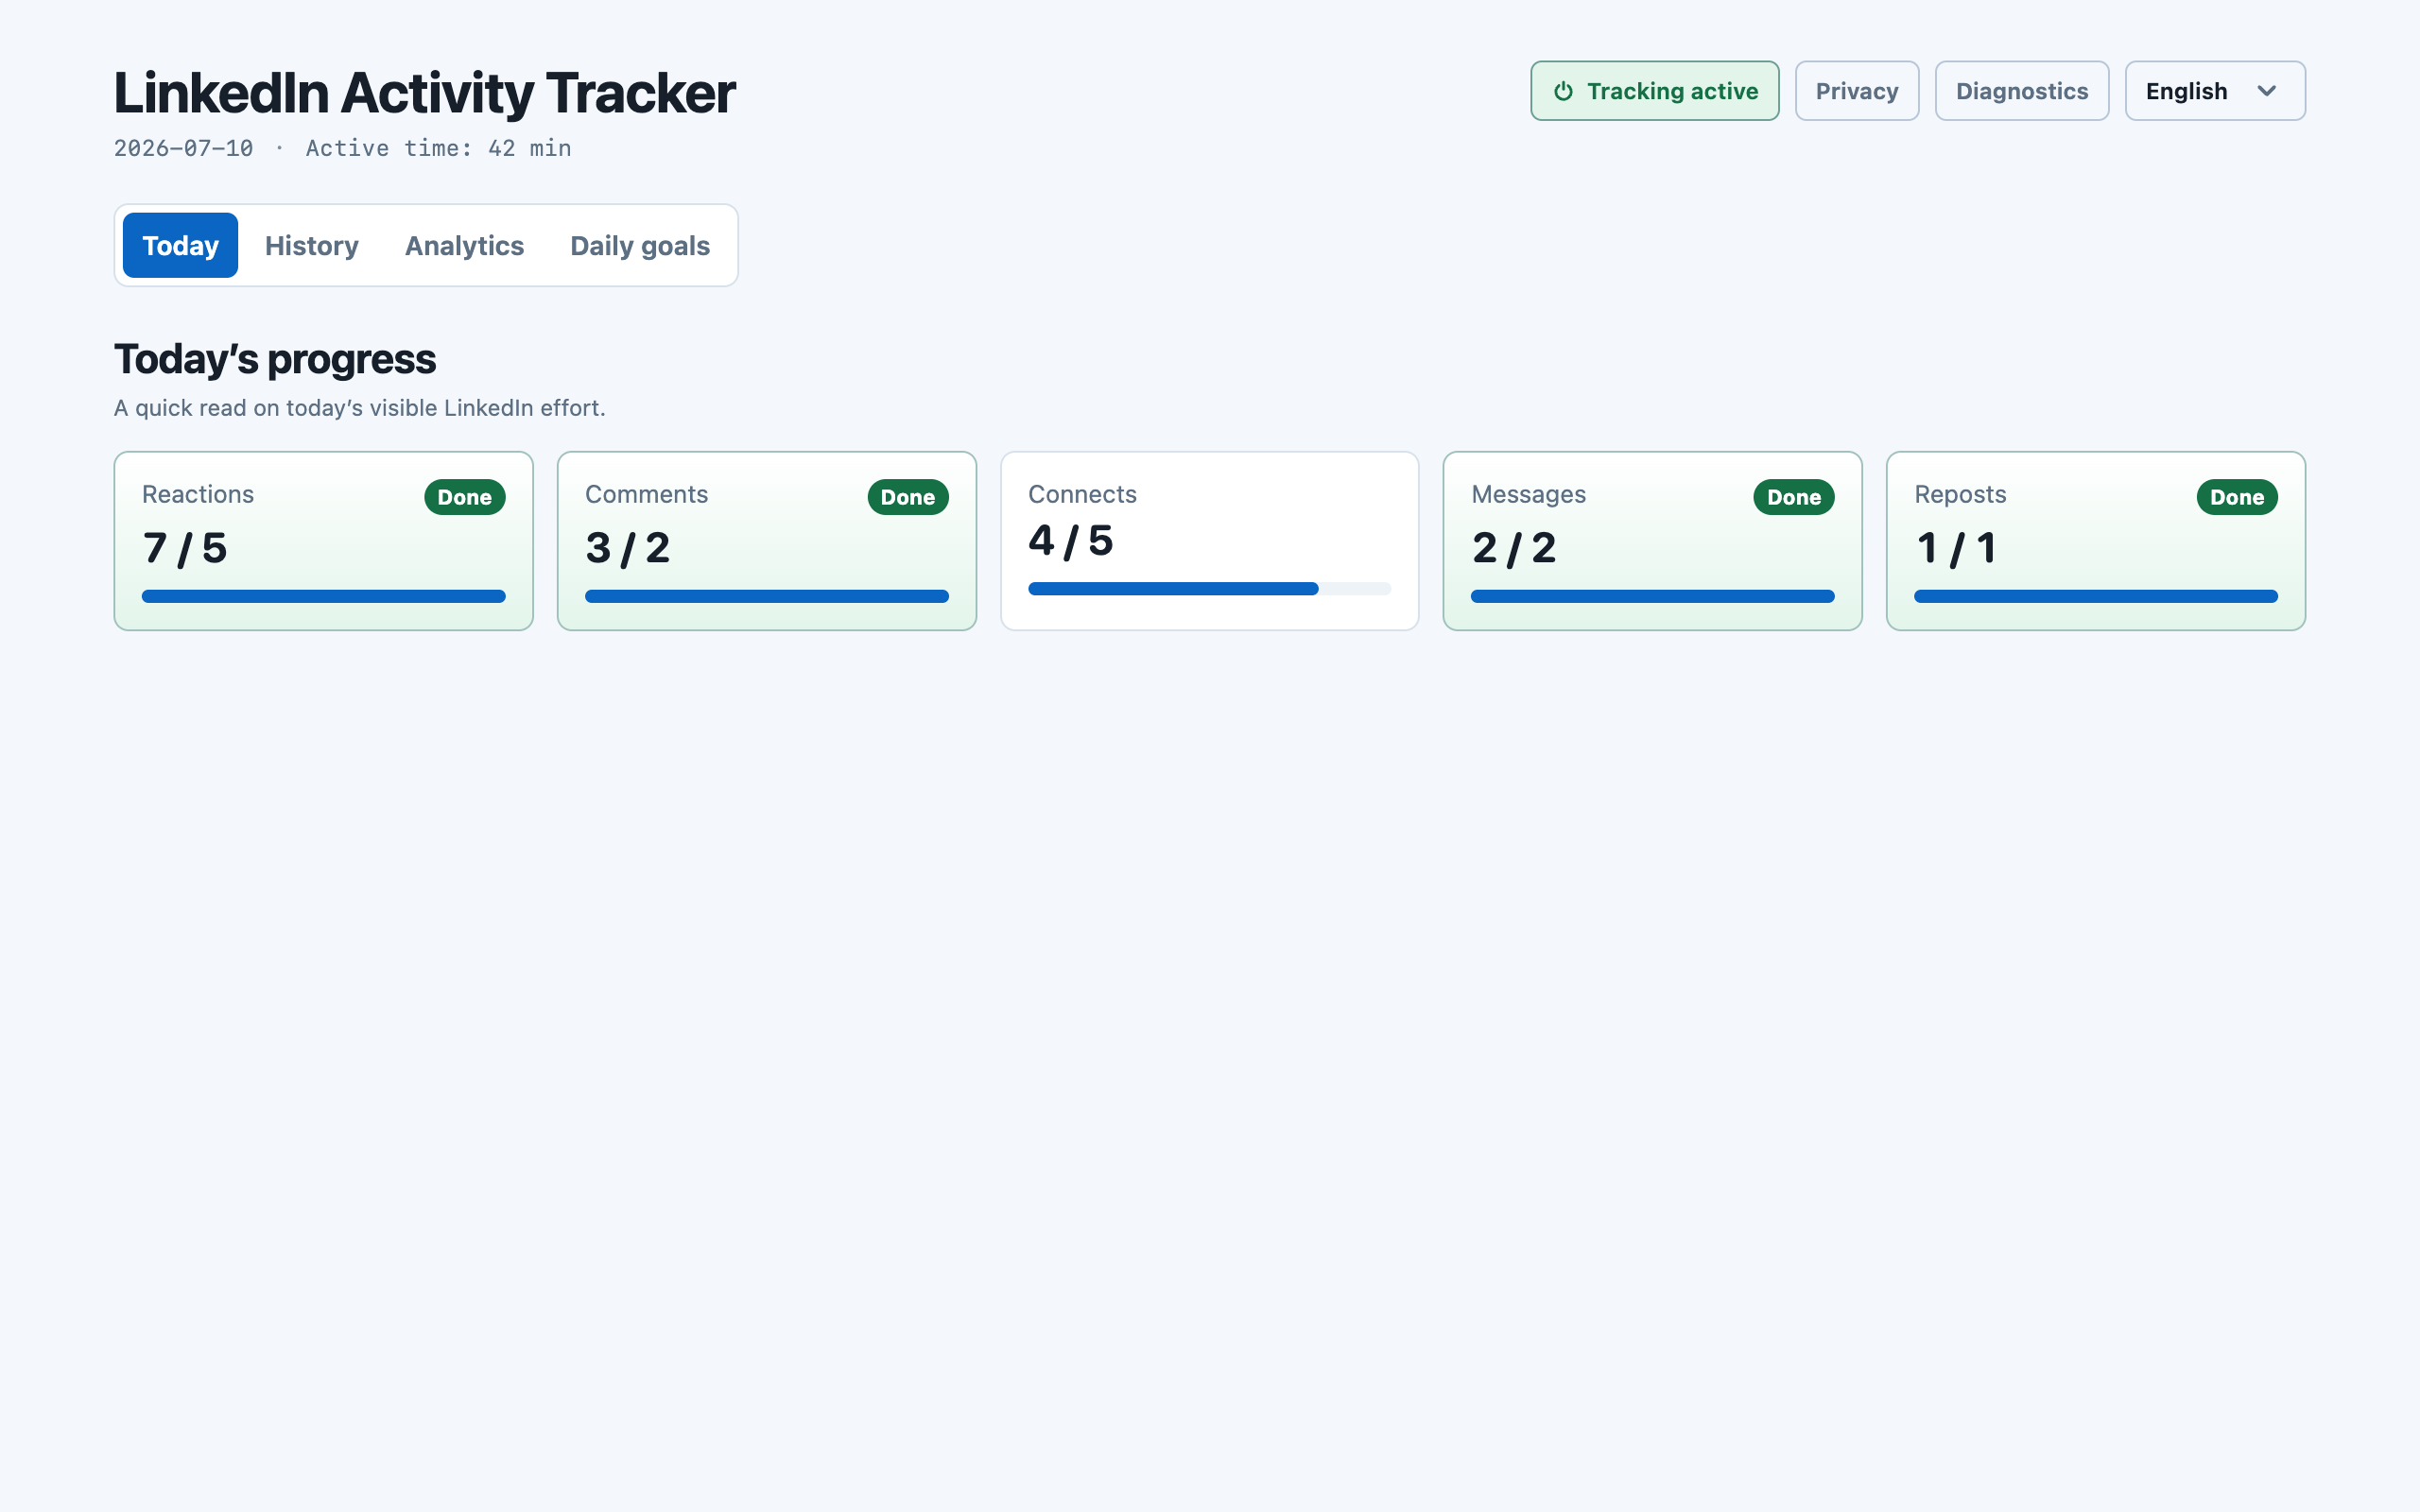
Pick daily targets for reactions, comments, connections, messages, and posts. Every action you take on LinkedIn fills the bar in real time — do the reps, clear the day.
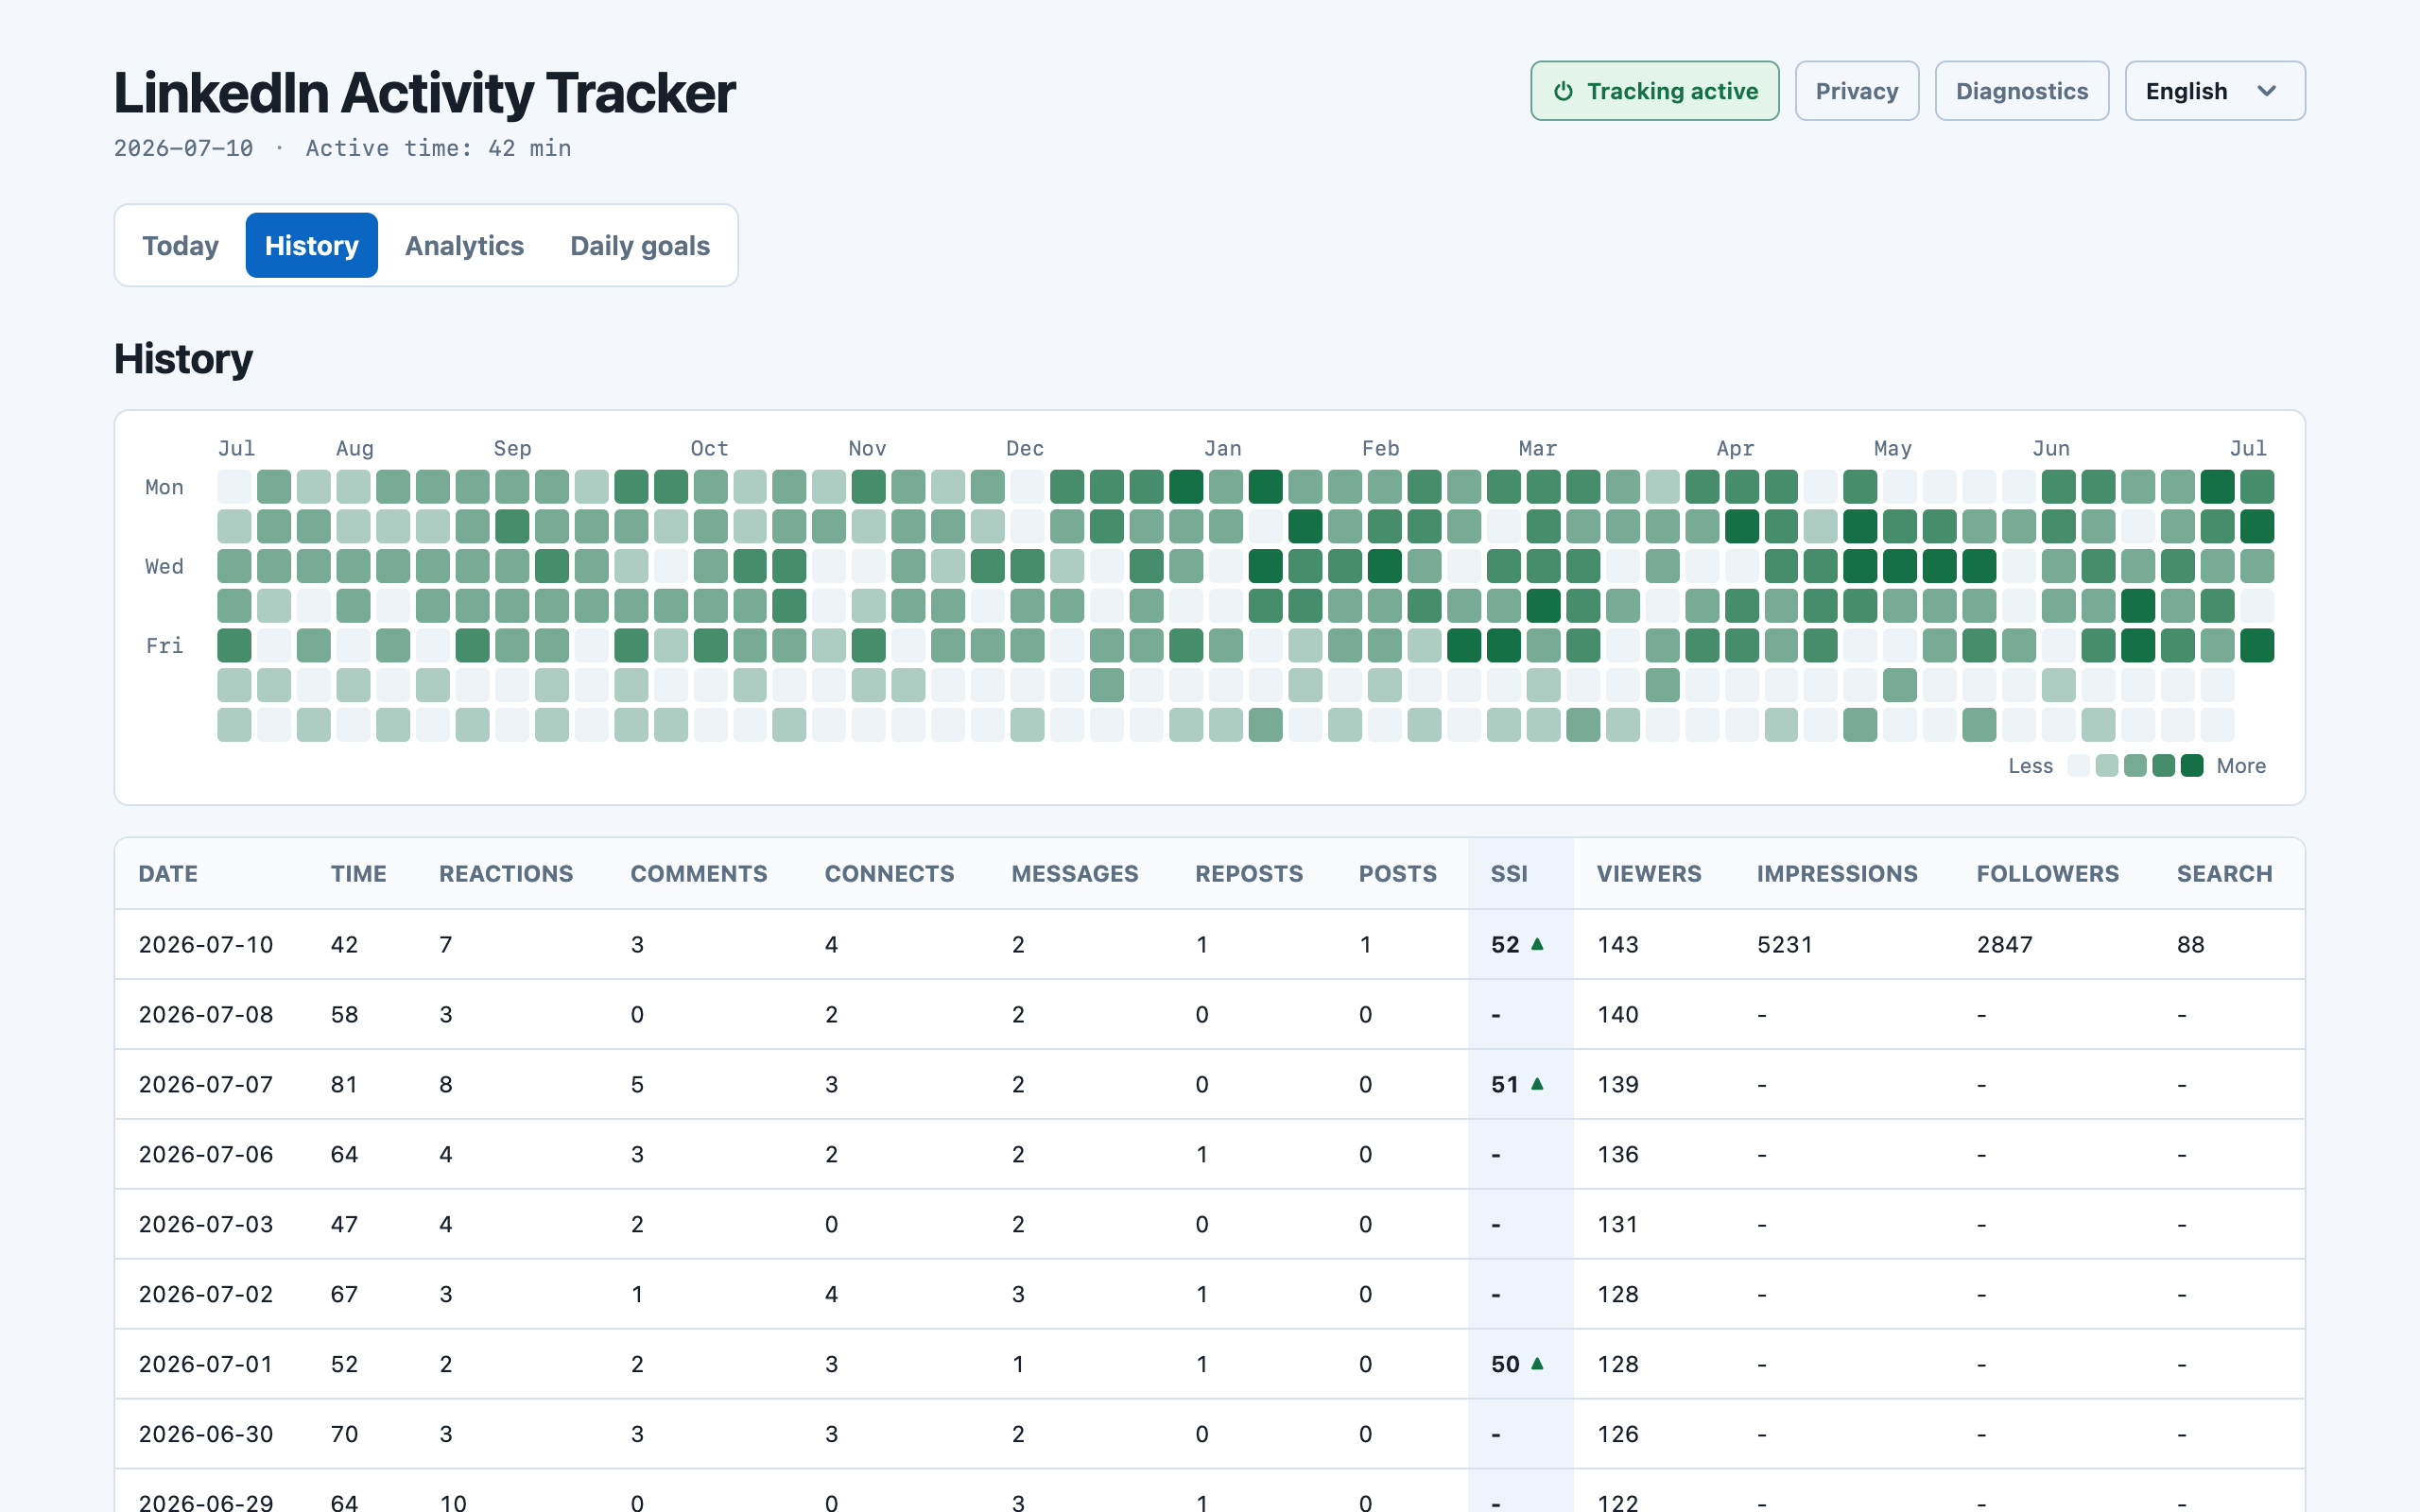
A year-long heatmap shows every day you showed up — and every day you didn't. Once a green streak builds, you won't want to break it.
The tracker snapshots your Social Selling Index every time you open the SSI page and lines it up with your daily activity — so you can see which habits were in play in the weeks your score climbed.
SSI is LinkedIn's own 0–100 score. The tracker shows activity and score side by side; it never modifies anything.
Social Selling Index
Three months of daily reps — illustrative data
This is not an automation tool — there is nothing here for LinkedIn to object to. It watches your own effort, and that's all.
It never clicks, likes, comments, connects, messages, or posts for you. No auto-anything, ever.
It counts the actions you take yourself. The core invariant of the codebase: observe, never act.
Data lives in chrome.storage.local.
No server, no account, no sync — and message, comment, and post text is never stored.
Read exactly what it does before you trust it — view the source on GitHub.
Add it from the Chrome Web Store — no signup, no configuration.
Keep doing what you do. The extension quietly counts the actions you take yourself.
Hit your goals, grow the streak, and watch your SSI trend on the dashboard.